








Key takeaways
- The S&P 500 and the Dow both closed Friday, Nov. 20, more than 10% below their record highs. That officially puts them in a “correction.”
- The S&P 500 fell 3.7% on Friday to about 6,910, and the Nasdaq dropped 5.3%, wiping out its gain for 2026.
- The selloff was driven by AI stocks unwinding (Nvidia, chipmakers, Anthropic’s shaky debut) and growing bets that the Fed will raise rates in December.
- Corrections happen about every couple of years on average. Most don’t turn into bear markets, but nobody knows in advance which ones will.
- For most people the plan is boring on purpose: keep your emergency fund in a high-yield account, keep contributing to your 401(k), rebalance if you’re way off target, and don’t try to time the bottom.
If you checked your 401(k) this weekend, you probably winced. On Friday the S&P 500, the index most retirement accounts lean on, crossed a line Wall Street watches closely. It’s now in a correction.
That word sounds scary. But a correction is also one of the most common things the stock market does. Here’s what it actually means, why it happened this time, what history says, and what you can do with your own money right now.
What is a stock market correction?
A correction is Wall Street shorthand for a drop of at least 10% from a recent high. A fall of 20% or more gets a different, scarier name: a bear market.
There’s nothing magic about 10%. It’s just a round number traders use to separate a normal wobble from something bigger.
Here’s where things stood at Friday’s close, according to CNBC and Reuters:
- S&P 500: down 3.7% on the day, closing around 6,910. It’s now more than 10% below its record close from Oct. 6.
- Dow Jones Industrial Average: down 949.73 points, or 1.93%, to 48,147.33, also more than 10% off its record.
- Nasdaq Composite: down 5.28% to 22,617.73. That erased its 2026 gain, leaving it down about 2.7% for the year.
For the week, the S&P 500 lost about 8.6%, its worst week since the tariff shock of April 2025. The tech-heavy Nasdaq fell about 10%, its biggest weekly drop since 2020.
Why stocks fell: the verified reasons
Several things piled up at once.
1. The AI trade is unwinding
AI-related stocks drove much of the market’s gains this year. When those stocks fall hard, they drag the whole index down with them. Nvidia dropped about 14% on Friday after Reuters reported that the Securities and Exchange Commission is looking into the company’s accounting. Other chipmakers like AMD and Micron fell sharply too.
Anthropic, which went public Thursday in a record-setting IPO priced at $83 a share, gave back much of its first-day pop. It fell more than 8% on Friday. Instead of re-energizing AI stocks, the debut became a reason to take profits. (We covered Anthropic’s post-IPO slide in more detail.)
2. Bets on a December Fed rate hike
Inflation is still running well above the Federal Reserve’s 2% goal. The Fed raised rates by a quarter point in September, then held its benchmark rate at 3.75% to 4% in late October. Now traders see a December hike as close to a sure thing. Reuters reported that CME Group’s FedWatch tool shows a near-certain chance of a quarter-point increase at next month’s meeting.
Fed officials aren’t pushing back on that. Governor Lisa Cook, one of two officials who voted for a hike in October, warned Friday that waiting too long “risks getting behind the curve.” Higher rates make borrowing pricier and make safer options like Treasurys and savings accounts look better next to stocks. Our earlier post explains what a December Fed hike means for you.
3. Fear is feeding on itself
Once a selloff gets going, it can pick up speed. CNBC noted the S&P 500 broke below its 200-day moving average this week, a long-term trend line that triggers automatic selling by some trend-following funds. Wall Street’s “fear gauge,” the VIX, rose to its highest close since April 2025, according to Reuters. And CNN’s Fear & Greed index slid into its “extreme fear” zone this week, according to Benzinga.
Investors moved into safer places. The 10-year Treasury yield fell back below 5% as money poured into bonds.
How often do corrections happen?
More often than most people think. According to research firm CFRA, as cited by the Associated Press:
- Corrections show up about every couple of years on average.
- Even during the nearly 11-year bull market from March 2009 to February 2020, the S&P 500 had five corrections.
- Of the 25 corrections since 1946 that didn’t turn into bear markets, the S&P 500 fell an average of about 14%, took about 130 days to hit bottom, and then about 112 days to win back its losses.
- The 14 declines that did become bear markets were much worse, with an average loss of 32%.
The last S&P 500 correction was in the spring of 2025, during the tariff turmoil. The last bear market was in 2022. The market went on to new highs after both.
The catch: nobody can tell you today whether this is an “ordinary” correction or the start of something bigger. Some analysts quoted by CNBC and AP think the selling has further to go. Others see a washout after a big run. Wharton professor Jeremy Siegel told CNBC he sees this as a reset of expectations after years of big gains, and his advice was simple: “Stay with your stocks.”
What this means for your money
We already covered the 401(k) basics in our stock market selloff and your 401(k) post. This time, let’s focus on the bigger money picture: your cash, your timeline and the moves that tend to backfire.
Check your timeline before you check your balance
The right reaction depends on when you need the money. If your 401(k) is for retirement 20 or 30 years from now, a 10% drop is a blip you’ll likely ride through many times. If you need the money in the next year or two, for a down payment, tuition or retirement itself, that money probably shouldn’t have been fully in stocks to begin with.
Make sure your emergency fund is real cash
The worst position in a correction is being forced to sell stocks at a low price because your car broke down or you lost your job. That’s what an emergency fund is for. If you don’t have one yet, our guide on building an emergency fund on a tight budget is a good place to start.
Your cash can actually earn something right now
One upside of higher rates: savings pay more. As of Nov. 21, the top high-yield savings accounts were paying around 4.4% APY, according to Bankrate and The Motley Fool’s rate roundups. Bankrate puts the national average at just 0.57% APY. So if your emergency fund is sitting in a big bank’s regular savings account, moving it to an FDIC-insured high-yield account could earn you real money with no stock market risk.
CDs and Treasury bills work for money you won’t touch for a set period. Just remember cash is for safety and short-term goals, not a replacement for long-term retirement investing.
Don’t panic-sell
Selling after a big drop locks in the loss. Then you have to decide when to get back in, and that’s the hard part. If you keep contributing to your 401(k) every paycheck, you’re buying shares at lower prices automatically.
Rebalance if you’re far off target
If you picked a mix like 70% stocks and 30% bonds, a big drop can knock that out of line. Rebalancing means trimming what’s grown and adding to what’s fallen to get back to your plan. Target-date funds do this for you. Inside a 401(k) or IRA, rebalancing doesn’t trigger taxes. In a regular brokerage account, it can.
Don’t try to time the bottom
Waiting for “the bottom” sounds smart, but almost nobody gets it right. If you have spare cash to invest for the long term, adding it gradually over a few months (dollar-cost averaging) takes the guesswork out.
Don’t count on one “safe” asset
Gold, the classic hiding spot, recently hit a 14-month low, as we covered in what gold’s slide means for your money. Diversification still helps, but no single asset is guaranteed to hold up.
What to watch next week
Next week brings the PCE inflation report, the Fed’s preferred inflation gauge. A hot number could strengthen the case for a December hike. It’s also a short week, with markets closed Thursday for Thanksgiving. Expect more swings, and try not to make big money decisions based on one day’s headlines.
The bottom line: a correction is painful, but it’s normal. If your emergency fund is solid, your investments match your timeline and you keep contributing, you’re doing what you can control. The rest is out of your hands, and out of everyone else’s too.
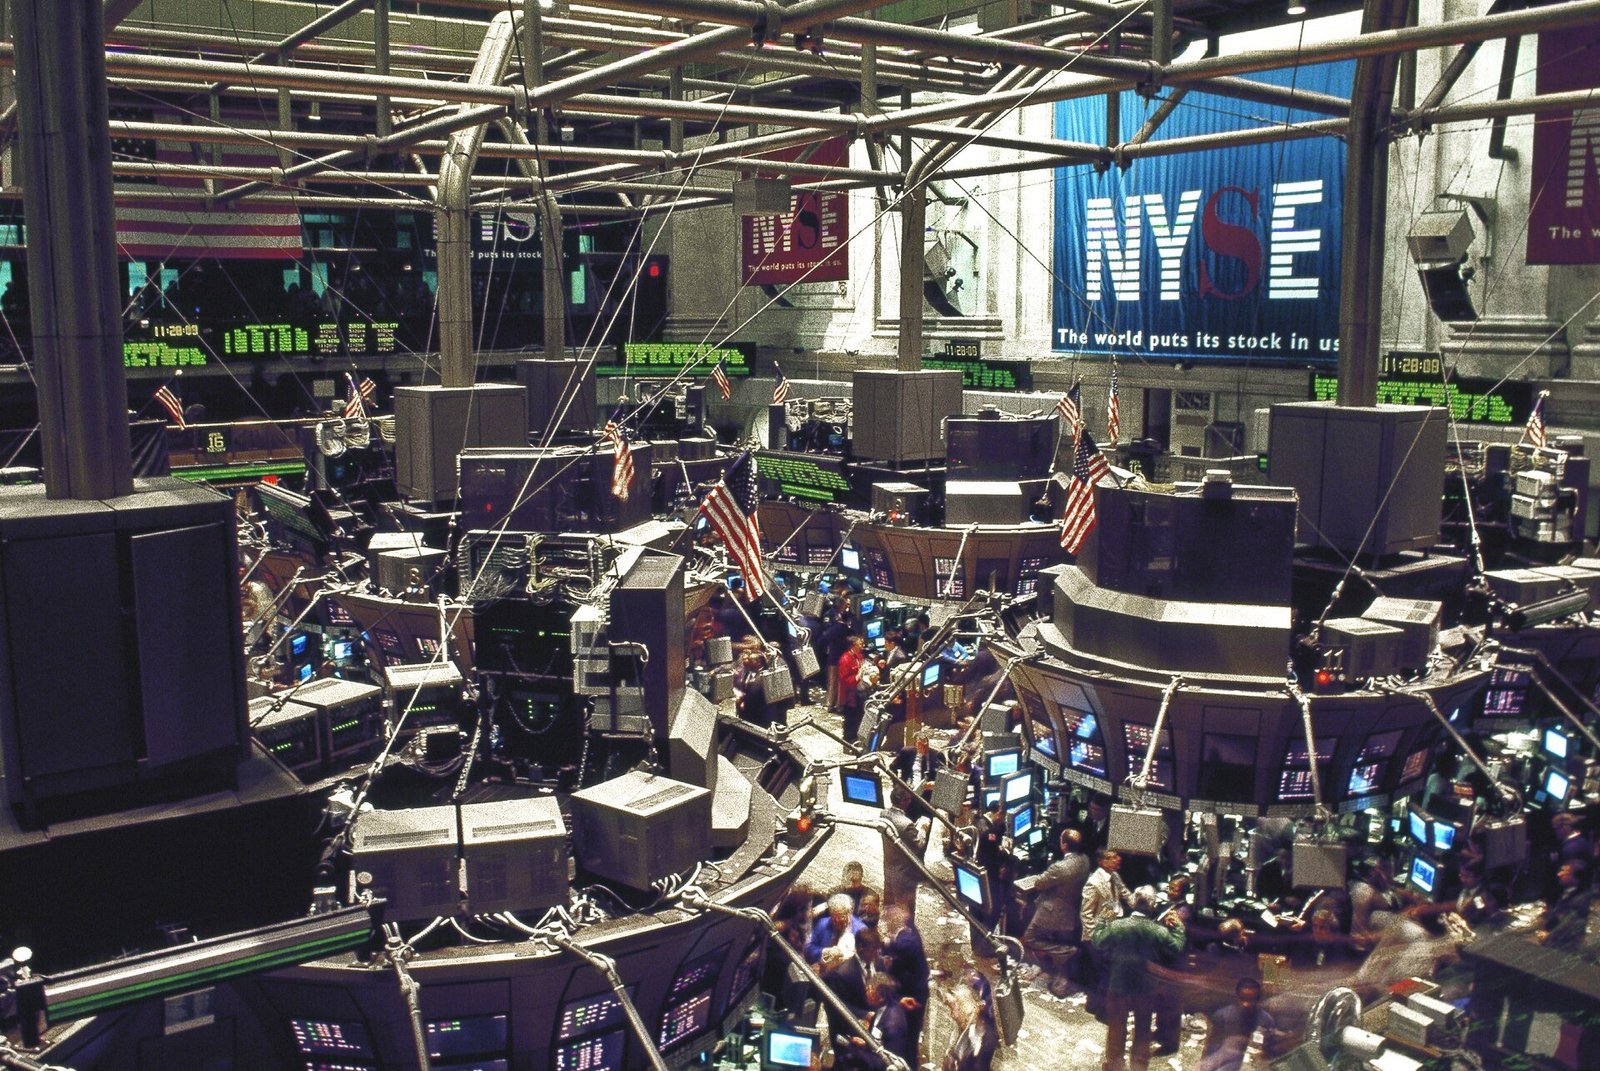
Image: Carol M. Highsmith / Library of Congress via Wikimedia Commons (public domain)
Sources
- CNBC – S&P 500 and Dow close in correction; Nasdaq erases 2026 gain as AI rout picks up steam
- CNBC – S&P 500 correction: Five forces behind the market sell-off
- AP – S&P 500 sinks 3.7% and the Nasdaq composite goes negative for the year
- AP – A 10% drop for the stock market is unnerving, but it’s not that unusual
- Reuters via Nikkei Asia – US stocks end sharply lower on AI selloff; S&P 500, Dow in correction
- Reuters via Investing.com – AI tech rout prompts US investors to rush into value stocks
- UPI – Dow, S&P 500 enter correction as Nasdaq plunges in AI stock sell-off
- CNBC – Stock market next week: Outlook for Nov. 23-27, 2026
- Federal Reserve – FOMC statement, Oct. 28, 2026
- Benzinga – Fear and Greed Index falls into “Extreme Fear”
- Bankrate – Best high-yield savings accounts of November 2026
- The Motley Fool – Best high-yield savings account rates on Nov. 21, 2026
This article is for informational purposes only and is not financial advice.